
Insights Dashboard
The Insights Dashboard provides an intuitive interface for exploring historical data through interactive visualizations and analytics tools, enabling users to identify key trends and patterns at a glance.
Customer Monitoring
Customer Monitoring identifies which product areas generate the highest support volume, helping teams understand where customers struggle most.
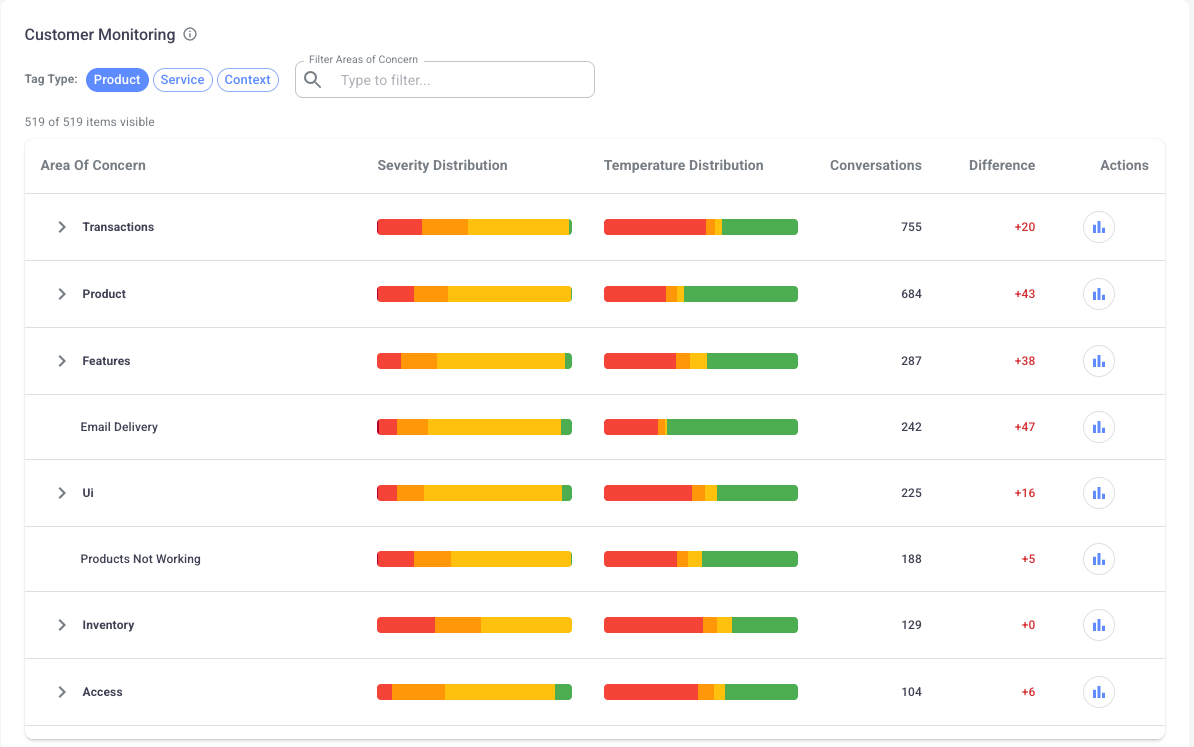
Understanding Feature-Specific Support Demand
Isara automatically tags each conversation and analyzes volume, sentiment, and topic trends. This highlights product features or workflows that may require attention.
Tag Types
Product: Tags that reflect the user's product experience, such as feature issues or usability challenges
Service: Tags that capture the quality of support interactions, including speed, clarity, and helpfulness
Context: Tags that provide information about the customer’s external business context, such as operational constraints or industry-specific factors
How to Use It
Review high-volume feature areas to plan product or UX improvements
Build targeted training materials for frequently misunderstood features
Detect new issues early and escalate them before they become widespread
Align documentation updates with the topics customers ask about most
Compare support volume across segments to understand user-type differences
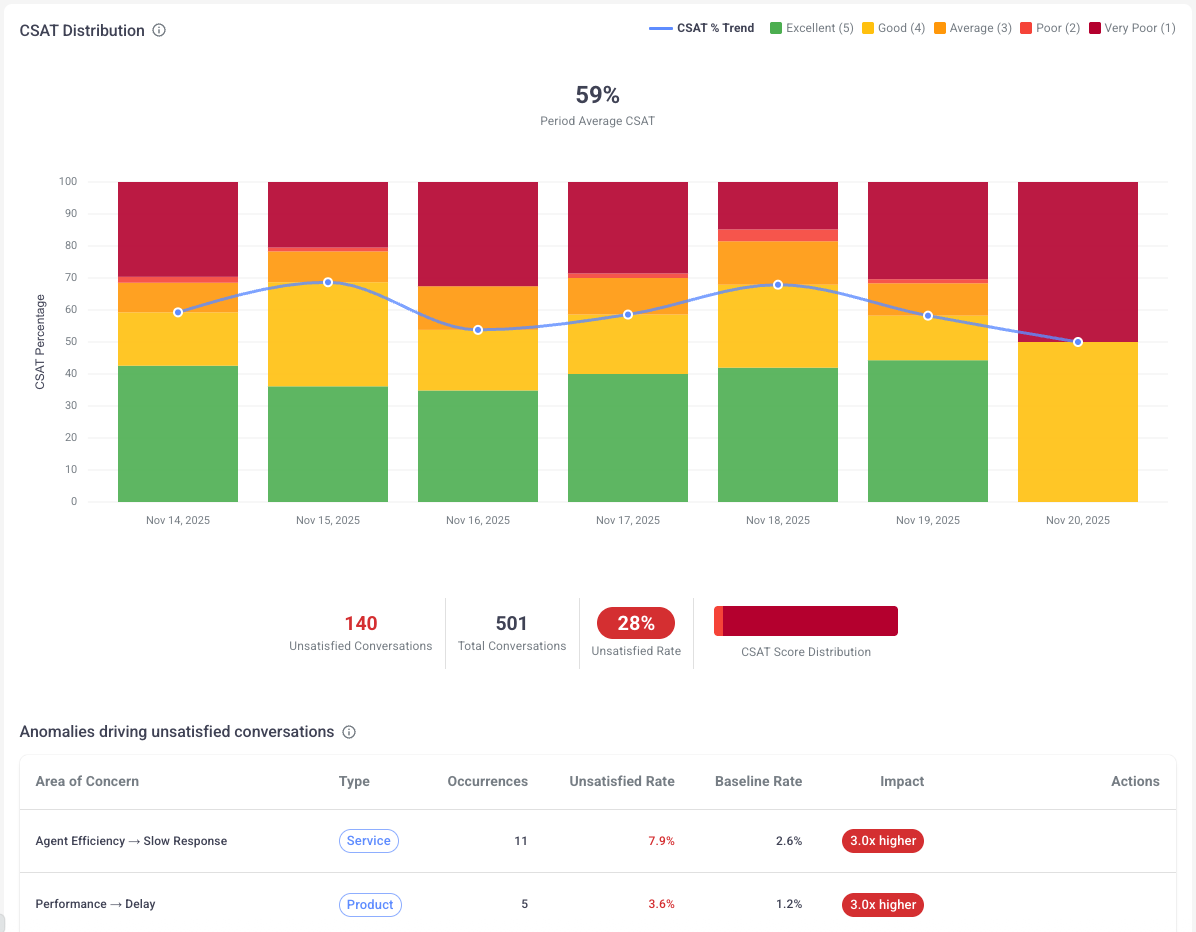
CSAT
The CSAT provides a complete view of customer sentiment by analyzing all interactions instead of relying only on survey submissions. It also highlights anomalies that Isara detects as contributing to low satisfaction, helping teams pinpoint specific issues that negatively affect customer perceptions.
How to Use It
Compare satisfaction levels across different time periods
Monitor changes after product releases or policy updates
Identify teams or workflows associated with consistently high or low sentiment
Use insights to validate whether improvements are having the expected impact
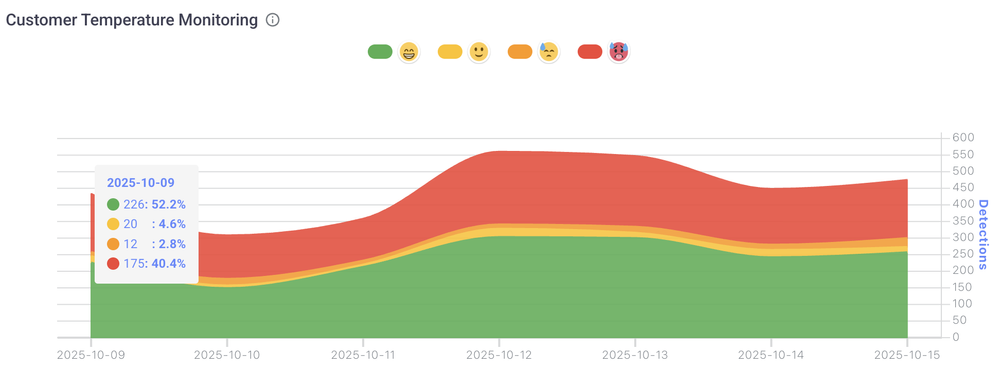
Customer Temperature Monitoring
Customer Temperature classifies the emotional tone of each interaction into four levels:
Cool (0): Positive or satisfied
Neutral (1): Balanced or neither positive nor negative
Warm (2): Mild frustration or concern
Hot (3): Strong dissatisfaction or anger
How to Use It
Track spikes in warm or hot conversations to detect emerging issues
Review hot conversations daily to prevent escalations
Combine temperature data with product tags to pinpoint root causes
Use temperature trends to evaluate support quality over time
Growth Opportunity Score
This metric evaluates the frequency and success rate of agents identifying and acting on opportunities to upsell a customer per conversation.
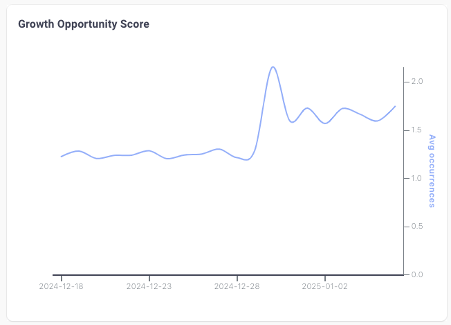
Identifying and Acting on Growth Opportunities
The Growth Opportunities feature automatically analyzes your customer conversations to identify potential opportunities for account expansion and upselling. By processing the natural language in your support interactions, the system flags conversations where customers express interest in additional features, mention scaling needs, or discuss pain points that could be addressed by upgrading their current solution.
Each conversation is assigned a Growth Opportunity score, helping your team quickly identify high-potential interactions that warrant follow-up. Support teams can use these insights to create a seamless handoff to sales, ensuring that valuable opportunities aren't missed in day-to-day support conversations.
For example, when a customer mentions needing to add more seats to their account or expresses interest in premium features, the system will highlight this as a growth opportunity, allowing your team to proactively engage with expansion opportunities.
Best Practices for Leveraging Growth Insights
To maximize the value of growth opportunity insights:
- Regularly review conversations flagged with high growth potential in your dashboard
- Establish a clear process for routing growth opportunities to your sales team
- Train support staff to recognize and properly document customer interest in additional features or services
- Use the aggregate data to identify patterns in customer needs that could inform product development or packaging strategies
- Set up automated alerts for conversations that exceed certain growth opportunity thresholds
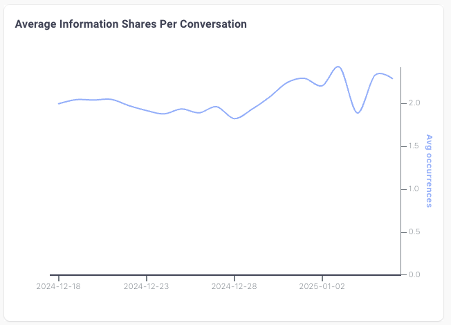
Average Information Shares Per Conversation
This metric tracks how often agents share relevant information before customers need to ask for it.
Information Sharing Metrics: Driving Customer Knowledge and Retention
Isara tracks the average amount of information shared by support agents during customer interactions, providing valuable insights into the educational component of your support conversations. This metric goes beyond simple problem resolution to measure how effectively your team is building customer knowledge and product understanding during support interactions.
Higher information sharing scores typically correlate with improved customer retention, as customers who thoroughly understand your product's features and capabilities are more likely to utilize its full potential.
The metric helps identify opportunities where support conversations can be leveraged as informal training sessions, transforming routine support interactions into valuable learning experiences.
Optimizing Information Sharing in Support Interactions
To enhance your team's information sharing effectiveness:
- Monitor the information sharing metrics across different types of support conversations
- Identify top-performing agents whose interactions consistently include comprehensive product education
- Develop templates and resources that help agents share relevant product information efficiently
- Use high-scoring conversations as training examples for new support staff
- Track the correlation between information sharing scores and customer retention rates
By focusing on information sharing during support interactions, organizations can build a more knowledgeable customer base while reducing the likelihood of future support tickets. This proactive approach to customer education through support creates a stronger foundation for long-term customer success and loyalty.
Updated 8 months ago